

plotwidget
Draw 2D plots
Description
Version 1.1:
Reduced the package size, added some functionality and minor visual tweaks.
Created using the excellent jQuery plugin
flot
.
How to use
All standard JavaScript
Math functions and constants
, are available, with and without the "Math." prefix.
Reference defined functions by using f[k](x), where k is the number corresponding to the function in the function list.
Define a constant by writing "c = k", where "c" is the constant name and k is the actual value. The name x is not available for constants.
Delete a function by double-clicking it in the function list, or by selecting it and pressing the 'delete' key.
Toggle the visibility of a function in the plot by clicking the corresponding numbered color box; the box becomes blank if the function is hidden.
Pan and zoom by double clicking, dragging and using the scroll-wheel in the plot area.
Resize window to reset the zoom and go to origin. Also, resizing the window scales the axis.
Note. The pan behavior is somewhat experimental. I'd love to get some feedback
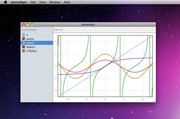
Screenshots
Download
This file has not been recovered yet. Do you have a copy? Tell us.
About this widget
| Downloads | 3,831 |
|---|---|
| Category | Science |
| Version | 1.1 |
| Size | 52KB |
| Last update | March 19, 2010 |
| Devices | desktop |
| Original page | Internet Archive |